
I’m sure you’ve seen this scenario play out many times. You or someone you know has completed a very compelling analysis that has some very important findings. The project team is excited to present the findings to the stakeholders. However, the presentation doesn’t go as expected. The executives in the room don’t seem to grasp the main points and the team struggles to get through all of the content that was prepared. The more details the team provides in order to get its points across, the more the eyes in the room gloss over. Instead of leaving the room as heroes who have uncovered an awesome business opportunity, the team leaves dejected having failed to convince the attendees to embrace the results and take action. There is one common cause of this scenario, which this blog will address.
A Presentation Should Be Verbal, Not Written
Many in the analytics and data science world make a major error when developing a presentation. Namely, they fail to distinguish between a detailed written document and a visual, live presentation that tells a compelling story. It is common to develop what is effectively a detailed overview document and then use that to present. See the example in Figure 1:
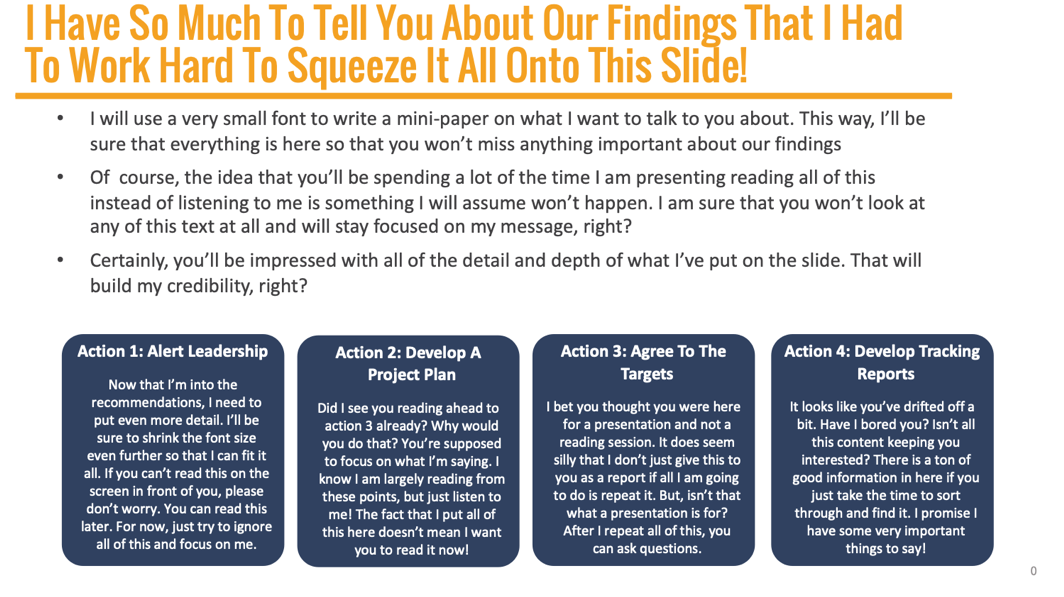
Figure 1
The slide in Figure 1 looks like many you’ve seen before. In fact, I have seen a lot of slides that have even more text! The slide is text-dense and hard to read. Your audience will try to read everything on the slide while you are talking, which will make them miss much what you are saying and lose context. Many presenters essentially focus on reading what is on the slide which only makes the situation worse and bores the audience.
The reality is that a slide in this format might be ok if it is being sent via email for someone to read on their own time. After all, people need to understand the details along with the main points. However, a slide like this will doom a live presentation and cause you to lose credibility. Your story will not be heard.
Focus On The Main Points And Talk To The Details
While it takes more work, it is important to have not only a detailed leave-behind or stand-alone document but also a shortened, visual presentation that can be used for a live presentation. The summary presentation should provide just enough information to highlight the key points you’ll be discussing in your story. See the example in Figure 2:
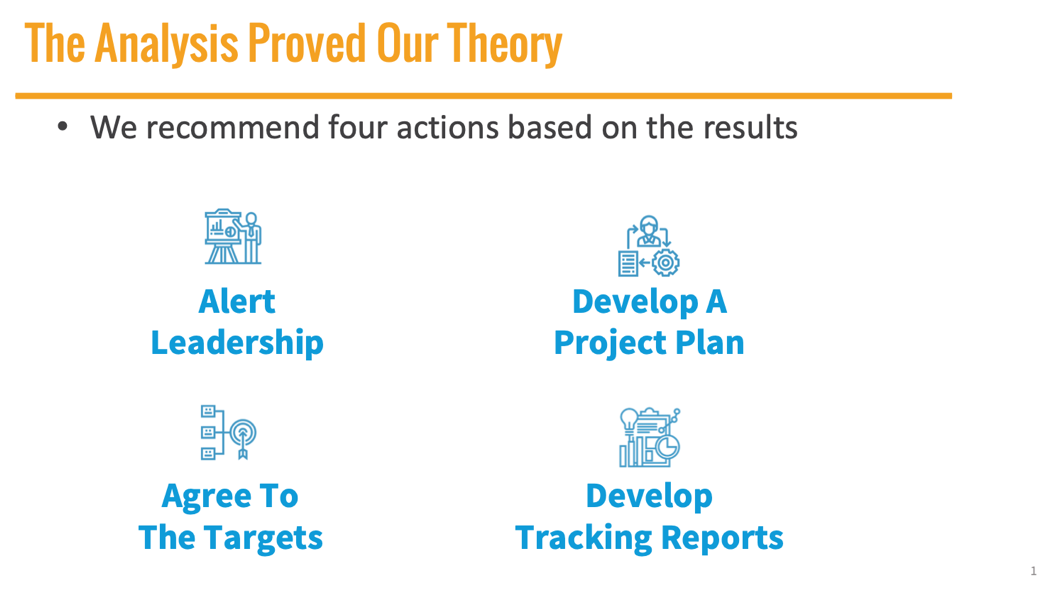
Figure 2
The slide in Figure 2 has only the most salient points on it and it should be presented using builds so that only one of the actions is revealed at a time. Even if the audience reads along, they’ll be done in a second and then will shift focus back to you. During the presentation, you can make all of the detailed points required, but you’ll do it verbally as you tell your story instead of in writing. After all, that is the whole point of a presentation isn’t it?
A few simple rules for your live presentation:
Only include the minimum text necessary. A live presentation is about a story, not written text
Never shrink your fonts to fit more words. Choose a large font that prevents you from saying too much and force yourself to develop crisp talking points (See Figure 3)
Use builds to keep focus on one point at a time. Any time you show multiple points at once, people read ahead and start making assumptions before you’ve told your story
Focus on visuals and illustrations as much as possible. Slides with visuals and few, if any, words are ideal for keeping an audience’s attention
Don’t fail to have a version you can leave behind that does contain the details. People will need that as a reference and as reinforcement for your story when they review it

Figure 3
Facts And Figures Are Not A Story
Whatever you do, never forget that the most effective way to compel your audience to action is to tell a story and not just recite figures and results. Both in your live discussion and your written leave-behinds, be sure to develop a story that will resonate with your stakeholders and help them understand why they should care about what you are presenting. Facts and figures have to be a part of that story, of course, but the story needs to go beyond the facts and figures.
How will the results help customers or improve a key business process? How will someone’s workday or life be improved if the analysis is acted upon? Your story should get people excited to act and to feel that there will be a positive impact beyond just a bump in margin. The more they personally connect with the results and feel they can be a part of something positive, the more they will be inclined to act.
The Goal: Don’t Write Your Story, Tell Your Story!
The primary takeaway is that when you’re presenting analytical results, it is your opportunity to tell a compelling story that both informs the audience of the key facts and figures and also engages and motivates them toward action. Your slides should just be visual backup for your main points. During the presentation, all eyes and attention should be focused on you as you present your story. There is plenty of time for people to read up on the details. That time is specifically not during your presentation.
While you’ll need to write your story in order to prepare for your presentation, the presentation is the time to tell your story!
Originally published by the International Institute for Analytics
Bill Franks, Chief Analytics Officer, helps drive IIA's strategy and thought leadership, as well as heading up IIA's advisory services. IIA's advisory services help clients navigate common challenges that analytics organizations face throughout each annual cycle. Bill is also the author of Taming The Big Data Tidal Wave and The Analytics Revolution. His work has spanned clients in a variety of industries for companies ranging in size from Fortune 100 companies to small non-profit organizations. You can learn more at http://www.bill-franks.com.
You can view more posts by Bill here.
Follow IIA on LinkedIn, Twitter and Facebook for more updates.