
So far in the AYDIJ series, we have explored a framework that has been proven to accelerate your data innovation journey: operating like a startup and thinking like an entrepreneur. In this piece, we focus on how to start your journey, and traverse the exciting and uncertain terrain ahead, while putting the concepts into action.
Many well-documented approaches for kicking off a project, program or initiative exist. Just Google “how to successfully start a project” and you’ll get over a billion responses. That’s right: billion. Too much to read? ChatGPT will chime in to summarize these for you. Even with all these helpful resources, McKinsey’s surveys show that only 30% of organizations have successfully completed their journey. Success isn’t just about knowing the steps or doing the work inherent to each step. It is about preparation, communication, and having a can-do mindset to get you through the rough patches.
Think about your last trip; it doesn’t matter if it was for business or pleasure. How did you know what to bring? Where to go? How did you decide where you’d eat or tour? Chances are you probably started with the destination and trip goals. Maybe you looked at the weather forecast, spoke with friends or coworkers to get their suggestions, or called upon the hive mind of your favorite social media channel to get input. Chances are good that you did something to prepare in advance. The same is true for your data innovation journey.
When you start your journey, the path forward is often misty, with limited visibility and potential surprises lurking at every corner. With curiosity, creativity, resourcefulness, and courage, you adapt to uncertainty and follow where the data takes you—moving towards a successful endeavor step by step. In time, the fog lifts and the path forward comes into focus. In our experience, it takes six to twelve months to get traction and eighteen to twenty-four months to see acceleration.
The Maturity Accelerator Plan or MAP is the action plan supporting your data innovation journey. The MAP aligns the analytics community on the current state of the environment, the vision going forward and the game plan for getting there.
MAPs are tailored to your organization and architected to reflect the data innovation journey for your enterprise, encompassing the progression from your present state to achieving your organization’s strategic goals and priorities. They also reflect the nomenclature and cultural tone of your organization. As the MAP evolves, it includes more than just a strategic roadmap; it’s a toolkit intended to provide a variety of resources similar to a Swiss Army Knife.
Anatomy of a MAP
Building a MAP is not a one-and-done activity. The goal is to do just enough to get started and evolve as you learn. We strongly recommend that you at least consider each section in advance so that you don’t have to scramble to complete them or inadvertently miss something that would have provided significant benefit.
MAP Contributors: In the spirit of acknowledging the contributions of the analytics community, the list of contributors is a simple but significant component. It shows the organization that there’s buy-in, acknowledges the voices that have shaped the MAP, and defines the core of the analytics community.
Analytics Landscape: This is very similar to a mini-business plan. It is the section that outlines the current state and desired destination. It includes the Why. Why are you embarking on this journey? In our last article, “Thinking Like an Entrepreneur,” we talk about why you need a Why. As stated by Simon Sinek, the author of Start with Why: How Great Leaders Inspire Everyone to Take Action, “People don’t buy what you do, they buy why you do it.” Furthermore, the process incorporates a SWOT (Strengths, Weaknesses, Opportunities, and Threats) — understanding these aspects at the outset and throughout the journey aids in making informed decisions.
To answer the Why, it’s really helpful to create an image that addresses each of the following questions:
- What is the opportunity (e.g., your organization’s strategic vision)?
- Where are we today (e.g., a representation of your current data and analytics ecosystem)?
- Where are we heading (e.g., a representation of what you want the future state to look like)?
- How will things change (e.g., how will data access and analytics change)?
We can’t stress enough the importance of using visuals instead of just words to align teams. Words alone often get interpreted differently by different people. Also, an image is a more effective method to engage the community in the discussion. We understand that it is easier to say than do—that creating the right visual takes time. Don’t worry about the initial quality, it will evolve as members of the community provide feedback. The goal is to ensure we all have the same vision and understanding before beginning the journey. Here are several examples:

Charter and Operating Model: Complimentary to the Why is the team’s purpose. A clear and concise mission and vision statement goes a long way to uniting and aligning an analytics community with different reporting relationships, and diverse business, clinical and technical expertise. This charter outlines the delivery teams and their area of focus, the stakeholder community and the governance structure. The focus of delivery teams will vary by organization based on strategic and operational priorities, as well as the level of data fluency within the organization. We’ll discuss selecting focus areas in the “Getting Started” section below.
It also contains a list of what is included and excluded from the scope, along with the metrics of success (indicating how the attainment goals with be evaluated).
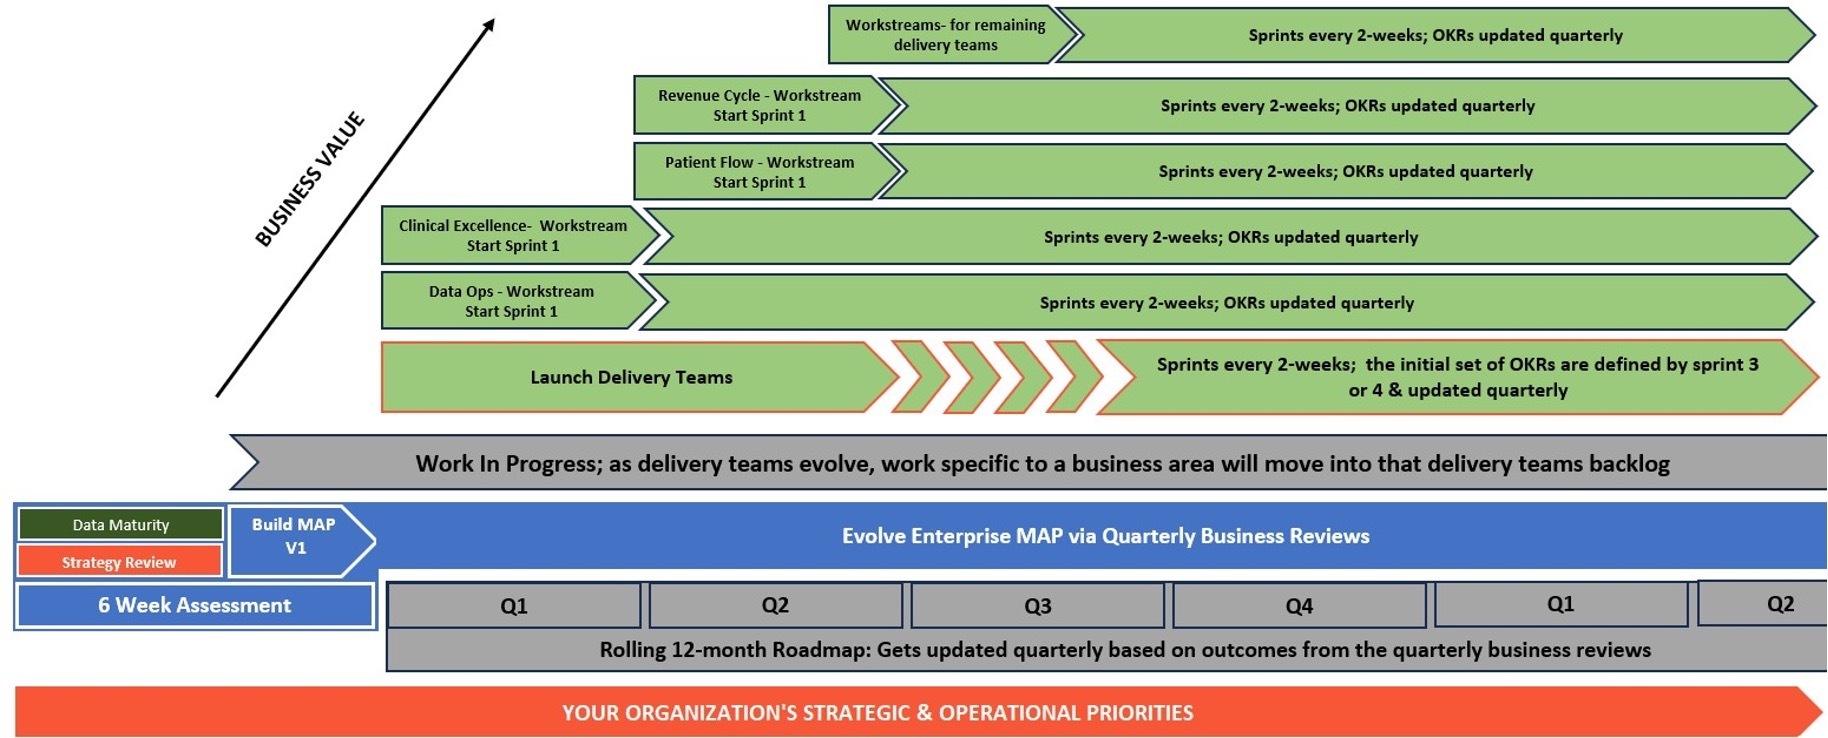
Strategic Itinerary (a.k.a. Roadmap): This is a rolling 12-month view of planned work. It is built initially from your starting point (data maturity baseline) and desired destination (organization’s strategic goals and priorities) and includes the evolution of the operating model. It’s a high-level view of the work and how it will get done.
Because work is defined every two weeks, it is impossible to define a detailed 12-month roadmap. It is meant to show incremental value over time. The OKRs we mentioned earlier fill in the roadmap detail for the current quarter. Together you get a complete picture. The roadmap sets the direction. The OKRs specify the key results for each objective set by each delivery team.
Supplemental Resources: This is intended to provide the community with additional information, including detailed results of the data and analytics maturity assessment report, an overview of the history and methodology of OKRs, an introduction to agile delivery within a federated operating model, as well as other tools designed to support the work.
In our last blog we talked about driving business value, articulating your Why, bringing people along, and the intrinsic value of motivation, among other things. The components of the MAP reflect this and provide resources and tools to address why 70% of organizations fail at delivering their strategic journeys.
Getting Started
Create an Enterprise MAP
Step 1. In the case of data innovation, you need to understand the starting point of your journey. You do this with a data and analytics maturity assessment tool. The results indicate your level of maturity in comparison to best-in-class standards and identify specific tasks required to advance as you prepare your organization for the upcoming data innovation journey.
As part of this process, make the rounds and learn what is and isn’t working from others. Talk to any and everybody interested in being part of the journey. This is an excellent opportunity to see the present state and future state from many perspectives. It also provides an opportunity to develop and practice the story and engage the community in the journey. This is very time-consuming if done right, but we can’t stress enough the importance of these discussions. Your role as the analytics leader is to represent this community – not your ideas but the ideas of the community. If you can cement this at this point in the process, you have taken an important step to success.
Step 2. Use the data maturity assessment report to identify the big pieces of work needed to support strategic and operational priorities in the next 12 months. In parallel, identify the people in your organization who will be on your executive sponsor team or E-team. You are looking for three leaders to represent operations, providers, and IT. A common configuration is COO, CMO, and CIO. However, it could be CFO, CNO, and CIO. The important thing is that these leaders report to the CEO, are respected for their ability to deliver, understand the importance of analytics to their success, and have an interest and aptitude to grow their data fluency. You would only have more than three executive leaders if research were part of the analytics community. In that case, you may also have the CRO or CSO on the E-team.
Step 3. Begin drafting the various components of your MAP. You’ll have enough information from steps 1 and 2 to identify the main focus areas and investments for the next 12 months. As you develop and evolve the MAP, continue to socialize with the analytics community to get feedback on the story.
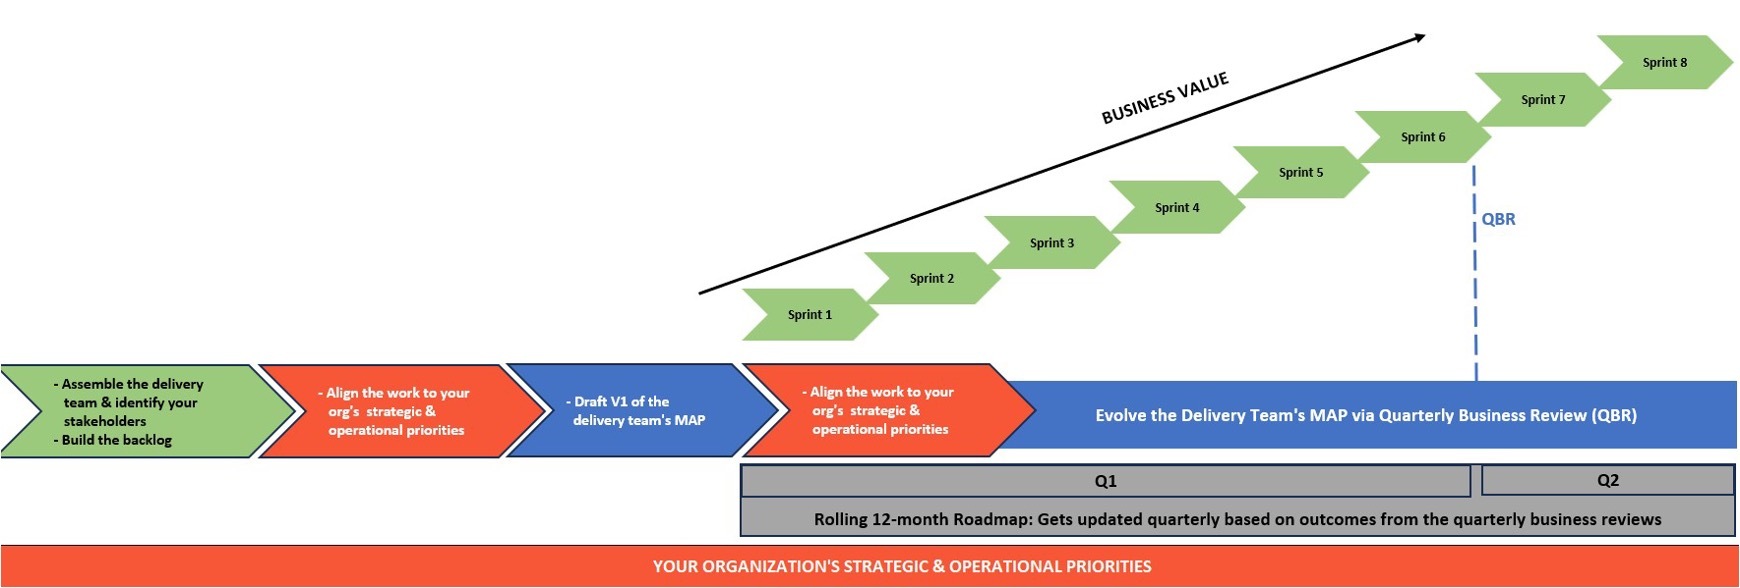
Form Initial Delivery Teams
Step 4. We recommend starting with two delivery teams. The first is the DataOps delivery team. This team will be responsible for the data and analytics/AI platform and support all other delivery teams. The other should be an end-user-focused delivery team (clinical excellence, revenue cycle, patient flow, clinical research, etc.). It’s best to start in an area with high visibility, high impact, and willing participants (business and clinical). Ideally, this would be an area where analytics is being done and they need help accelerating their journey.
The teams will work in two-week sprints. The early sprints are bumpy as the new team learns to work together differently. The team will need four to six sprints to get in their groove. But know the additional value the team will deliver once they are at max potential will be far greater than if they didn’t shift to this operating model.
As you may recall, delivery teams leverage a modified version of SCRUM. The product owner maintains a backlog of work and sets the priorities for what needs to get done based on the input they have collected from their stakeholder community, as defined by their charter. Based on those needs, the dev owner decides which technologies to use, how to create technical synergy across delivery teams, and determines the quality or work product for the rest of the team. The delivery team takes guidance from the product and dev owners, and each team member chooses what they can do in a given sprint.
The team composition will vary based on the focus area, but each team includes 5-8 people with diverse skills. Each delivery team comprises:
- The product owner: someone with a deep understanding of the business area they represent and an affinity for technology.
- The development owner (dev owner): someone with a deep understanding of the technology and an affinity for the business.
- 3-6 additional people with expertise based on the area of focus and type of work this team will do: data engineer(s), data analyst(s), data scientist(s), software engineer(s), security, data-ops, data architect, etc.
Step 5. Identify the next few focus areas for subsequent delivery teams. Start by identifying the highest business need (where you can deliver the most value, where you can address significant challenges), and then consider the leadership for those areas. Are they willing to consider a change in exchange for greater business value over 6-12 months? If they are reluctant or resistant to change, find other more accepting areas. Always focus on willing participants. Our last blog in this series, “Thinking Like An Entrepreneur,” highlights the importance of identifying the champions and ambassadors, as well as the saboteurs and thieves working against you. Over time, as more delivery teams demonstrate value, the most resistant areas will come around.
Once an area is selected, the product and dev owner create a MAP for their delivery team. This is very similar in purpose and structure to the enterprise-level MAP. The most significant difference is scope. Once the E-team reviews and approves this delivery team MAP, the delivery team will be launched.
The life expectancy for a delivery team can be as short as 12-18 months or as long as 2-plus years. Once these teams are formed, they continue to operate as long as they drive value to justify the investment, or it is decided that greater value can be achieved elsewhere.
A key factor in selecting an area of focus for a delivery team is whether it aligns with strategic and operational priorities. Here are examples we have implemented in other organizations.
- Clinical: patient flow, clinical excellence, quality and safety, mental and behavioral health, health equity, surgical services, ambulatory, medical specialties, critical care, integrated care network, clinical value, etc.
- Business operations: supply chain, revenue cycle, finance, strategy, HR, facilities, donor management, etc.
- Research: clinical research, basic science, systems medicine, etc.
- Data and analytics/AI technology: DevOps/DataOps/platform services
Step 6. Delivery teams build their backlog and define their OKRs for the quarter. John Doerr’s book Measure What Matters: How Google, Bono, and the Gates Foundation Rock the World with OKRs shares a practice and process that has yielded success in many organizations, including those we have had personal experience with. OKRs (Objectives and Key Results) differ from KPIs (Key Performance Indicators). Not only should they change on some regular frequency, they are tied to your organization’s strategic and operational priorities, whereas KPIs are tied to performance (e.g., system health, employee goals, customer response, etc.). OKRs relate directly to the success of your MAP. They’re a way of determining success along the way and providing you with information to adjust or stay the course.
Regarding tracking and reporting, we advocate for just enough and recommend an agile-like delivery process (covered in the “Operating Like a Startup” article). With an agile methodology, the team and stakeholder community review progress every two weeks. There’s no better way to provide transparency than to share what you plan to work on and what you have accomplished every two weeks.
As a reminder, this is an iterative activity and not something that needs to be perfect before action can begin. Many projects get stuck in the planning phase. It’s OK to continue planning or plan just enough. The beauty of a scrum-like approach means that you start with what you know and refine and continuously improve as you go forward.
Harmonize the MAPs
Step 7. As the different delivery teams are stood up, each will define their OKRs for the quarter to frame their sprints. And each will perform a quarterly assessment of their OKRs and how they support the evolution of the MAP as a standard governance practice. Keep in mind, the first six months can be bumpy but stick with it, things will improve.
Put the operating model into motion. The delivery teams will own their work and focus on delivering value for their business area. They will define their OKRs and use them to report progress. They will identify the work for each sprint and use a tracking system to maintain their backlog, assign work to each sprint, and note progress on those activities as they move forward.
The product owners will work closely with key individuals from the stakeholder group to identify and align on the priorities. The development owner will work closely with their peers and other data and technology experts to minimize redundancy, maximize reuse, ensure quality deliverables, and work toward data innovation.
Step 8. Governance and quarterly business reviews. Every quarter, the leaders of the delivery teams will gather with their peers to share progress on their OKRs for the recently conclude quarter and present their OKRs for the upcoming quarter. Likewise, the product and dev owners of the delivery team huddle with their executive team (e-team) to do the same but at a higher level.
There are multiple goals for the peer-to-peer discussion:
- Enables the delivery team leadership to address issues around data ethics, data governance, data fluency, etc.
- Ensures alignment across teams (especially for those contributing to a cross-organization effort)
- Creates awareness of the technologies and approaches used by each delivery team to solve a challenge or issue so that others can leverage the learnings and save time or prevent missteps
- Inspires data innovation
The e-team huddle is meant more as an update than a request for approval or permission to proceed. In return, the goal is to get feedback from the e-team members so that the delivery team can remain aligned with strategic plans and adjust priorities if needed. Additionally, the e-team members expect to share relevant updates from their delivery teams with the rest of their organizations.
Guiding Principles
Communication is key. True leaders motivate and excite people to join them willingly rather than dragging people along for the ride because they were “voluntold.” Bring others along by keeping them informed, encouraging participation, and listening to their feedback and ideas. The scrum ceremonies are designed to help achieve these outcomes.
Honor the scrum ceremonies. It might seem like meeting every two weeks is a lot of time, but these ceremonies ensure that all involved are kept up to date and have a chance to weigh in along the way. The ceremonies include:
- Delivery team huddles (15-20 minutes) should occur daily (at least M-Th).
- Backlog grooming: one hour every two weeks (ideally a few days before the end of the sprint) in advance of sprint planning, used by the product owner to set priorities for the sprint planning session.
- Sprint planning: one hour every two weeks (ideally the afternoon of the last day of the sprint or the morning of the next sprint) to align on the scope of the sprint.
- Sprint review: one hour every two weeks (ideally the morning of the next sprint) to align on the progress of the sprint that’s now concluding.
- Sprint retrospective: 30 minutes every two weeks (ideally right after the sprint review and before the sprint planning) to identify things that went well, things that didn’t go well, and agree on what, if any work, the delivery team will include in the next sprint (or put on the backlog) to address things that didn’t go well.
- Stakeholder meetings: as needed, members vary depending on the scope of the sprint.
- A-Team huddle: this is a monthly meeting with an end-user representative to share progress and solicit guidance.
- E-team huddles: these often start monthly as the community is being formed and evolve to quarterly or semi-annual.
Shift the mindset. Healthcare, in general, is full of people who are keen to say, “We can’t do this” or “We tried this before and failed.” With that, the conversation is closed. But the problem still exists. The issues remain real because no one is willing to find out why a previous effort failed. No one is willing to be curious and ask what is true now that would enable us to be successful in the future.
Many things that get in the way of starting an effort come back up when a challenge arises while the effort is underway. In our collective 60-plus years of navigating complex change, new initiatives have yet to go smoothly 100% of the time. All have had at least one major challenge arise, and many had several challenges and obstacles that needed to be overcome. The majority of these are due to poor or no communication, lack of preparation, and a can’t-do mindset. (“Thinking Like An Entrepreneur” offers several suggestions for encouraging a can-do mindset and bringing others along.)
Avoid Analysis Paralysis. In the realm of data innovation, analysis is critical. But too much is paralyzing. The beauty of the MAP is its iterative nature. Start with just enough to get going. Adjust course (when needed) along the way. Set the 12-month goal and monitor progress quarterly using OKRs. Allow the delivery teams to do their thing. Working in 2-week sprints minimizes analysis paralysis and often removes it. Trust the process and let it unfold for the first 3-6 months. Our experience has shown that this approach works and delivers business value (cost reduction, improvement in care, increased access, etc.) very quickly.
In Closing
The purpose of the MAP is to engage the analytics community (from executive leaders to frontline leaders to clinicians and data engineers) in a discussion on how analytics and AI can be leveraged to power data innovation that realizes the promise of the overarching goals of better outcomes, improved patient experience, improved clinical experience, health equity, and lower costs. In addition, the MAP engages the community in developing the path forward and where to start. Preparation is crucial in framing a successful journey. The art is figuring out just how much preparation. The key is to do just enough to get started and take lessons learned on your journey to evolve the MAP. In about 12-18 months, revisions to the MAP slow down as the destination becomes clear and the organization's operating model (and mindset) becomes more institutionalized.
So far, we have discussed the business landscape and the importance of data innovation, the operating model and mindset to accelerate your journey, and how to get started on that journey. In the next article, we will explore the technology platform that provides the foundation for the analytics/AI ecosystem. There are so many technologies, products and practices that it is hard to envision how they all fit together in a cohesive data and analytics platform. That will be the focus of the next piece. We will provide a reference architecture you can use to guide the evolution of your platform. We will answer the questions: What capabilities exist in a mature data and analytics platform? Where do vendor offerings fit? What should you consider as you evolve? We’re confident it will generate a lot of good discussion.
Onward to the next stage in accelerating our data innovation journey.