
According to the Centers for Medicare & Medicaid Services, the US spent over $4 trillion in 2021, which amount to $12,914 per person on healthcare. This figure is the highest among all the member countries of the Organisation for Economic Co-operation and Development (OECD). For comparison, Switzerland, with second- highest expenditure, allocated $8,049 per person. Yet, US lifespan, and maternal and infant mortality rates the worst among high-income countries in the OECD. What’s more, during the COVID-19 pandemic, despite accounting for only 4% of the world’s population, the US accounted for 16% of the global COVID-19 related deaths in 2021. This has had significant physical and mental health repercussions, particularly for our heroic healthcare professionals.
Every time I read or hear these stats, and it is often, it is like a punch in the gut. Everyone is working incredibly hard, yet progress on the Quintuple Aim remains elusive. If anything, it feels like we are losing ground. How can we leverage the analytics & AI ecosystem we have discussed to start bending the curve?
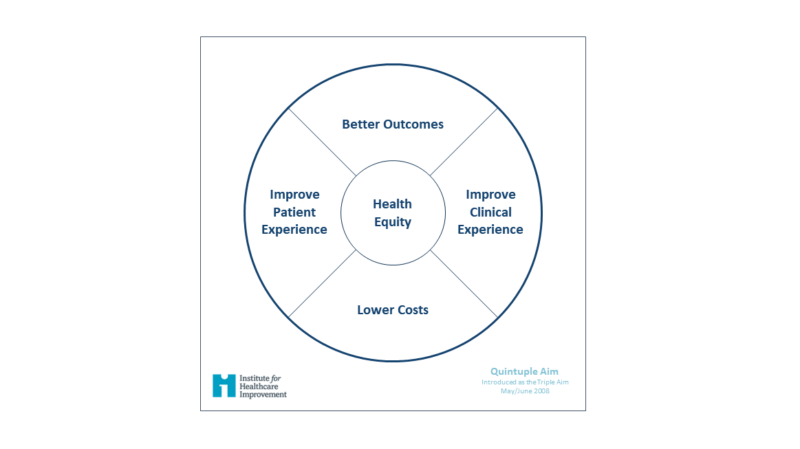
If you are unfamiliar, the Institute for Healthcare Improvement (IHI) introduced the Triple Aim framework. It was conceptualized by Donald Berwick, Thomas Nolan, and John Whittington, and was first described in a 2008 article in Health Affairs. The framework was developed to guide healthcare organizations and systems in optimizing health system performance by simultaneously focusing on improving the individual experience of care, improving the health of populations, and reducing the per capita care costs. The Triple Aim provides a valuable framework to focus our efforts and measure progress.
Over time, the Triple Aim evolved into the Quadruple Aim and then the Quintuple Aim to include clinical experience and health equality. Of all four dimensions, it is worth highlighting health equity. By addressing this dimension alone, we can improve all other dimensions impacting patients, communities, and workforce. Deloitte estimates the impact of health disparities on healthcare spending to be $320 billion a year, and the NIH estimates the economic burden to be $451 billion or 2% of GDP. Fix health equity and all other dimensions get better.
Tom Lawry highlights another area of opportunity in his book Hacking Healthcare, stating, “Many studies have looked at why America is first in spending and last in results. Most conclude that a causal factor is the reactive nature of the US health systems. Characteristics of a reactive model include:
- Most expenditures support a “break-fix” model of care delivery
- Minimal investment in health improvements (as a percentage of total healthcare spend)
- A significant number of citizens faced with access issues
- A de-emphasis on public health”
So, if we can responsibly use the growing corpus of data being produced as the patient experience is being digitized, leveraging analytics & AI at scale, we can become proactive in care delivery and eliminate health inequities. We can bend the curve, realizing the promise of the quintuple aim.
As you read this, it is easy to become a bit overwhelmed — maybe a lot overwhelmed. I know I do at the start of a journey. Fortunately, we have the building blocks. As we have discussed, patient (consumer) experience is becoming increasingly digitized, making massive volumes of patient data available and the tools for leveraging that data continue to improve at an accelerated pace, especially with recent introductions of generative AI.
Also, we have learned how operating like a startup and thinking like an entrepreneur creates an ecosystem that emboldens the community and allows us to start small and evolve — delivering value incrementally and often. We also discussed starting the journey with a MAP (Maturity Accelerate Plan). Now, it is time to get to work. It is time to take that first step. It is time to start bending the curve.
Over the next few pieces in this series, we will discuss proven data products being leveraged in other organizations to make them proactive and improve health equity. These solutions are not presented in any particular order. They should be pursued in alignment with your strategic and operational priorities. And, as always, in areas of the organization where you have willing participants and people who have a strong desire to partner.
To get started, we will focus on a common area within organizations, both in healthcare and beyond: streamlining and unifying decision-making. To this end, we will discuss a proven framework that has been used at a massive scale to begin to bend the curve. Let’s get started.
Streamline and Unify Decision Making
There is a significant opportunity to change how information is consumed in an organization. Let’s assume you have built a single version of “truth” using well-curated data marts, as we discussed in earlier pieces — or have at least begun this journey. It is time to focus on streamlining and unifying decision-making using this “truth.”
To get started, it is helpful to understand the problem. In most organizations, data consumption looks a lot like the illustration below. As you can see, each senior leader has to distill data from multiple sources to understand the health of their business. This could take 30 minutes or more daily. Even at that, there are holes in their understanding and that understanding doesn’t reconcile with peers or team members — requiring more time to reconcile the different versions of health.
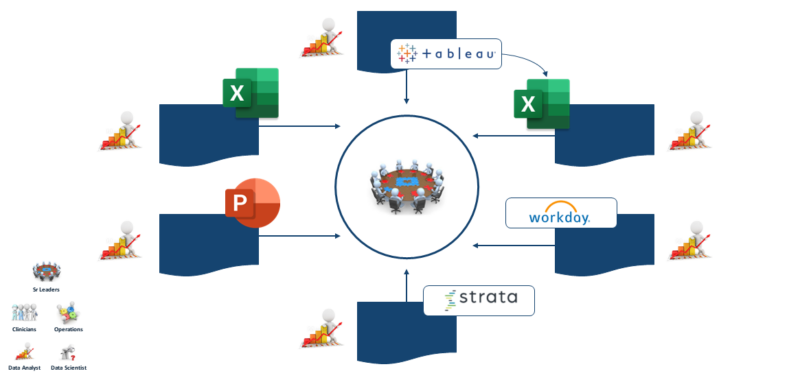
This problem is further compounded as we pan out and see the multiplying effect on the broader organization. Even with a single version of “truth,” this ecosystem guarantees everyone will interpret this “truth” in many ways — after considerable time and effort. This makes decision-making slow, costly, and inconsistent. Also, the value of these decisions is often limited because these "truths" are not timely (sometimes days old) or predictive, and they are not easily accessible through mobile devices.
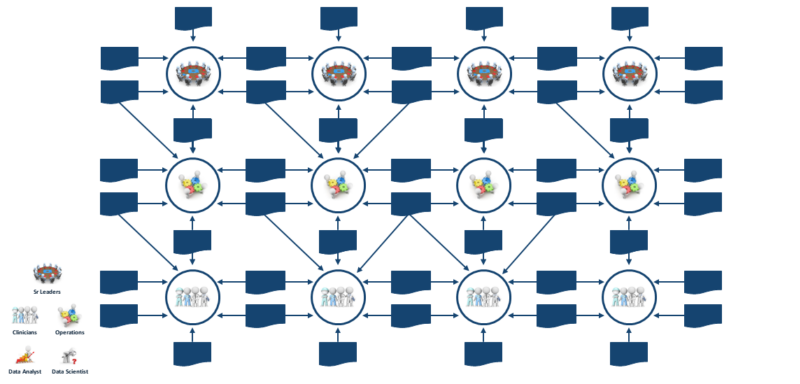
My first experience with this problem was at a retail company in the early 2000s. They had thousands of retail locations where store managers spent thirty minutes to an hour each day in the backroom, attempting to comprehend their business. So, we decided to build a “workbench” to tell them the health of their business in no more than four minutes with a clear call to action. The goal was to get store managers out of the business of wrangling and analyzing data. Sound familiar? This business case justified the largest IT capital investment ever at the time.
Fast forward several years, and the “workbench” was being leveraged across all retail locations. Not only did we achieve cost savings, but we also realized many other valuable benefits. Store managers spent more time on the floor with employees and customers, which led to improved marketing and sales efficiency. Stores became better aligned with divisions and regions, and best practices for running a store were institutionalized in the dashboard, reducing the time required for new store managers to come up to speed.
This framework has since been adapted and leveraged within healthcare organizations like Seattle Children’s with even greater success. Let’s take a look in more detail at the framework.
Pulse Framework
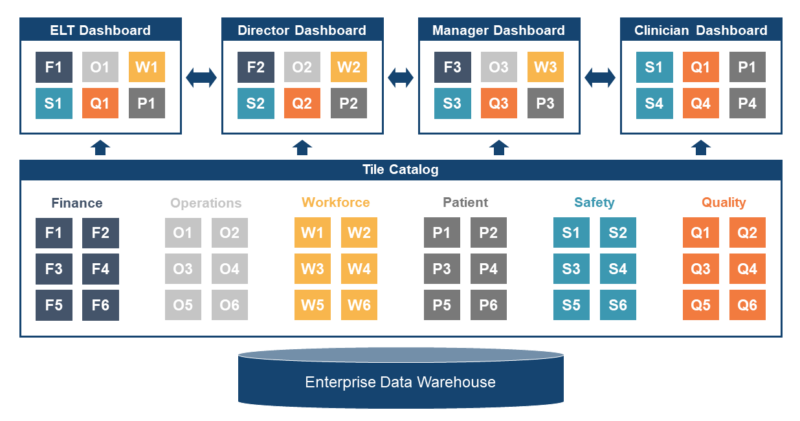
The framework’s purpose is to streamline and unify decision-making by providing the end-user with the health of their business at-a-glance with guided navigation to information to support action. This becomes the source of “truth” for decision-making and action. See image below.
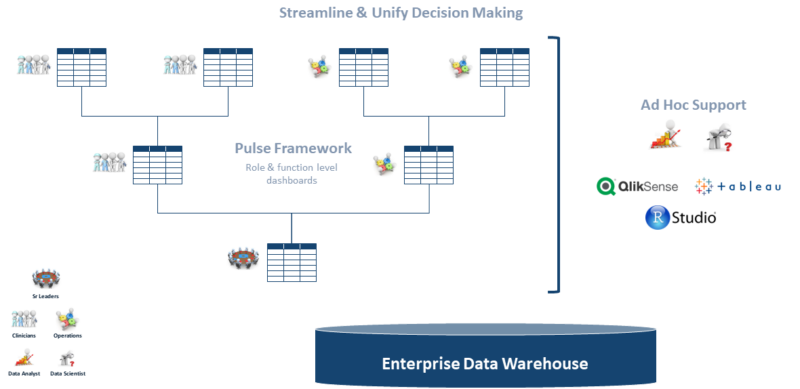
Since this ecosystem helps each leader understand the “pulse” of their business, I have referred to this data product as the Pulse Framework or just Pulse. Here are the core characteristics of Pulse.
- Monitor: Empower end users with the health of their business in less than 4 minutes. To this end, deliver content appropriate for the role or group, whether it be the board, executive leader, nurse manager, quality and safety initiative, patient advocate group, donors, etc. These users should have access to Pulse through mobile devices, whether connected or not, to the company network. Also, using large screens in meeting locations where teams come together can be impactful (e.g. daily clinical operations huddle.
- Act: Highlight “call to action” with guided navigation to relevant details to act. Over time, this should evolve to alert end users proactively. The goal is to liberate people by allowing them to practice at the top of the license, focus on the work, and spend less time analyzing data.
- Harmonize: Metrics and dimensions will harmonize across different organizational levels to promote consistency.
- Analyze: Support exploratory and explanatory analysis by providing data analysts and data scientists access to the single version of truth used by Pulse.
- Institutionalize: As the Pulse ecosystem evolves, it should capture best practices for each role and group. If not, you haven’t distilled the information to a sufficient level.
If you are executing well, you could have a dozen delivery teams working independently to develop Pulse dashboards that feel like they were created by one team. For example, if you see a predictive census on one dashboard, it will be the same predictive census on the other. Also, the dashboard motif will be the same as end-users navigate the environment like your experience navigating Amazon.
Now that we have explored the Pulse Framework, let’s look at the dashboard anatomy.
Pulse Dashboard Anatomy
As you start to think about your design, it is helpful to remember that you are creating an ecosystem and not just a dashboard. The goal is to create a design that minimizes the cognitive load for the end users, and a motif that will scale to support the needs of many end users and end-user groups. It is also important to remember you are not serving data to analyze; you are telling a story with data that allows the end user to understand the health of their business at-a-glance. A great source of guidance for developing the design is a book by Cole Nussbaumer Knaflic called Telling Stories with Data.
The design I promote results from years of trial and error, and input from many UX designers who are a lot smarter than me in this space. If you are embarking on this journey and not a UX designer, I highly recommend you find one. Starting with a solid UX design is essential. If you have a strong relationship with one of the BI tool vendors, they often have people who can help — sometimes for free.
My preferred design presents metrics in tiles and organizes these tiles into columns that represent priorities for a role or group. Tiles are often simple numbers color-coded to indicate a call to action. This way, the end user can easily see if something requires attention. If there is a call to action, they select the tile to get the detail needed to take action — ideally without leaving the main dashboard. To provide context, each tile includes “as of date” and an indicator to inform the end user if a data quality issue is being researched. Also, end users have easy access to business rules.
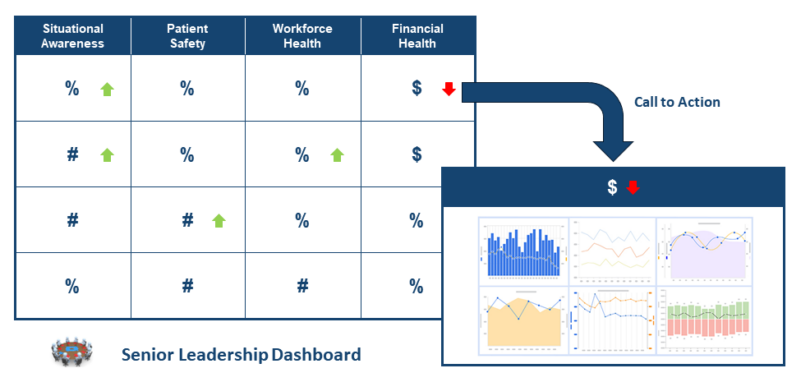
Selected metrics should be something of interest throughout the work week. The columns are organized with the most time-sensitive category on the left and the least on the right. If there are weekly, monthly, or quarterly categories and metrics, create a tab allowing the end user to navigate these time periods quickly – with a different dashboard for each period. This is quite common for tracking progress relative to the annual operating plan.
As you build out these dashboards, it is important that behind the scenes, you are building shared objects (data marts and tiles). In this way, you help ensure consistency in metrics on the dashboard and reduce ongoing maintenance. Also, having shared objects helps to accelerate the delivery of new dashboards as you get further along in your journey. Below is a conceptual illustration of the repository that enables the dashboard.
Dashboard Governance
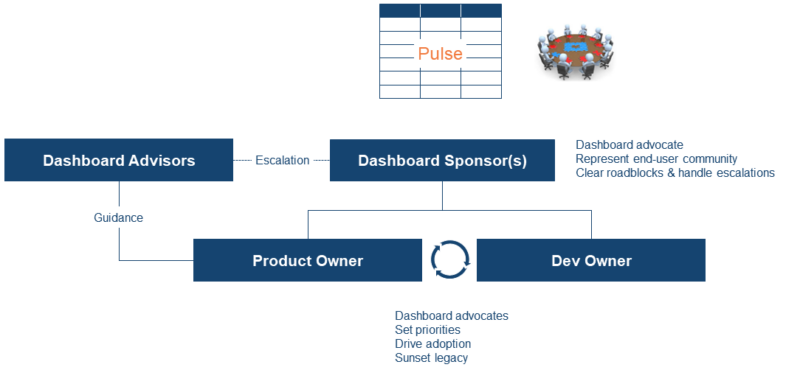
Central to the governance of a Pulse dashboard is the delivery team. Each dashboard has a delivery team owner, similar to data marts. They are responsible for designing, implementing, and maintaining the dashboard. To support their efforts, there are 1-3 dashboard sponsors who represent the user community. If you want a larger representation, add an advisory team rather than expand the dashboard sponsors. This helps to keep decision-making timely and efficient. This advisory team can be used to provide guidance and pilot new versions of the dashboard before being released to the wild. They can also be very helpful in driving adoption. Below is an illustration of how the governance plugs into the existing delivery team operating model.
Selecting a Tool
Many tools could potentially be used to support the Pulse Framework. While I have my preferences, as do many others, I will try to make it simple and tool-agnostic.
There are two things to look for that are critical to making this framework work. The first is support for templates. This creates consistency across the ecosystem (color, structure, etc.) and allows changes to propagate quickly with little effort. Most tools do this well.
The other feature is sharing tiles and related data objects across the dashboards. This will allow object reuse, promote consistency, and simplify changes. Some BI tools do this better than others, and some don’t do it at all. This is an essential feature to consider when selecting a tool. Though some BI tools get close, I don’t know of any that does this fully. If you have a strong software development team, one option you may want to consider is doing something custom.
Getting Started
This follows a common theme through this series: start small and iterate, demonstrating value incrementally and often. Pilot one or two areas critical to the business, where end users are comfortable with a “test and learn” approach to partnering. The goal is to demonstrate value and formalize a framework that can be leveraged across the analytics community. Ideally, one of the pilots will focus on building a Pulse dashboard for senior leadership (VP and SVP) and the other on a crucial operational area (e.g. patient access, revenue cycle, supply chain, etc.).
As you start on your pilots, focus on two tiles (i.e. measures). Get these rolled out and functioning before adding more. Then, add no more than two tiles at a time until you complete the dashboard. This will simplify resolving the many issues you will encounter as you iterate on the requirements and data nuances, and build out the ecosystem (tile catalog, data marts, etc.).
Also, focus initially on getting the tiles working and less on the data plumbing. As the tiles are finalized and used, then clean up the plumbing. This allows you to move quickly in delivering value and receiving feedback on the requirements early and often.
There are a few things to consider to promote the adoption, drive value early, and bend the curve. Provide measures that the end user can’t find elsewhere. In many environments, this can include near-time and predictive measures on items like census, staffing, expense, health equity, etc. Also, ensure the solution is mobile-enabled. This will go a long way to driving adoption and moving the organization in a proactive direction.
In Closing
The Quadruple Aim has been elusive. However, we can bend the curve by using the federated operating model to leverage a growing corpus of data that is becoming available as the patient experience becomes increasingly digitized, accelerating your journey to improve lives. Changes in two areas will have a profound impact: making organizations more proactive and improving health equity. One of the places to start this journey is to implement a framework that will streamline and unify decision-making in the organization, Pulse.
In the next piece, we will explore how to get data into the hands of more end-users by providing greater self-service. We will explore impactful use cases and available tools to help you accelerate your journey.